
How to Look Up Fairfax County Jail Population Data
Population data lives in two main places. The Sheriff's annual report carries the yearly snapshot, including average daily population and demographics. The county's adopted budget for the Office of Sheriff carries performance measures, such as prisoner days and healthcare contacts. Neither source is a live count, and that is by design. A daily number would change by the hour.
So the right approach is to read the official report figures and treat them as averages. The numbers below come from the FY2024 Sheriff annual report and the FY2026 adopted budget. For an individual person, the name search runs through a different tool, covered later on this page.
Fairfax County Jail Capacity Overview
The Adult Detention Center is a connected three-building complex with a rated maximum capacity of 1,260 under Virginia Department of Corrections standards. The buildings opened in stages over more than two decades. The table below shows how capacity grew.
| Building | Opened | Capacity Note |
|---|---|---|
| East Building | 1978 | Original 198 capacity |
| North Building | 1987 | Brought total to 589 |
| West Building | 2000 | Completed the complex |
| ADC total | -- | Maximum 1,260 |
The complex uses single-cell, linear, podular, and direct-supervision housing styles. More than half of the inmates are housed in direct supervision.
Average Daily Population and Prisoner-Day Trend
Average daily population, or ADP, is the steadiest measure of the jail population. The FY2024 ADP was 666, up from 659 in FY2023. Later budget materials show an FY2025 actual of 594 and estimates around 600 to 625 for the next years. Prisoner days, the total count of all inmate-days in a year, rose over the same period.
| Metric | FY2022 | FY2023 | FY2024 |
|---|---|---|---|
| Prisoner days | 222,691 | 239,735 | 242,005 |
| Average daily population | -- | 659 | 666 |
The FY2024 annual report also lists 16,305 commitments and 9,712 inmates for the year. Commitments count bookings, so that figure is far higher than the daily population.
The gap between those numbers tells a useful story. With a daily average near 666 but more than 16,000 commitments, the jail clearly cycles many people through short stays rather than holding a stable group all year. The short average length of stay supports that read. Budget materials also project prisoner days rising toward 260,000 or more in later years, so the trend is worth watching across each new report.
Demographic Breakdown
The FY2024 Sheriff annual report gives a clear demographic snapshot. The population skews male and relatively young, and most stays are short. The table below shows the reported figures.
| Measure | FY2024 |
|---|---|
| Male | 84% |
| Female | 16% |
| Average length of stay (male) | 23 days |
| Average length of stay (female) | 10.5 days |
| Average age range | 18-38 |
| Single marital status | 72% |
The report lists an average educational level of 11.21 and a median education level of a high school diploma. A race and ethnicity breakdown was not in the official source set reviewed.
Capacity Versus Actual Population
With a rated maximum of 1,260 and an FY2024 ADP of 666, the simple ratio is about 53% of rated capacity. That number alone does not tell the whole story. Usable capacity is shaped by classification, gender, medical needs, mental-health status, protective custody, and staffing.
So a jail can be below its rated total and still feel tight in a given housing unit. The official budget also reports staffing vacancies, which affect operations even when the overall population sits below the rated maximum. A simple "not crowded" conclusion would miss those constraints.
The ADP also moved down recently, from 666 in FY2024 to an FY2025 actual near 594, before estimates settle around 600 to 625. A drop like that can reflect diversion work, charging choices, court pace, and many other factors at once. Because the figure is an average, a single month can run higher or lower without changing the yearly picture.
Mental Health and Medical Population
Healthcare is a large part of jail operations in Fairfax County. The FY2024 budget reports 530,879 healthcare contacts with inmates and an average healthcare cost of $45.09 per prison day. Those numbers point to a population with significant medical and behavioral-health needs.
The county's Diversion First effort aims to keep eligible people with mental illness out of jail when possible. The county reports a 26% decrease in the jail behavioral-health population with misdemeanor charges from 2015 to 2024. A specific charge-category or mental-health census was not published in the source set, so these program and cost figures stand in for that detail. For the diversion programs themselves, see the Fairfax County arrest records page.
Programs, GEDs, and Staffing
The jail runs education and program services alongside custody. In FY2024, 359 inmates received GEDs and certificates from developmental programs. The Sheriff's Office transported 2,012 prisoners that year and reported one prisoner, staff, or visitor death.
Staffing pressure shows up in the budget too. The FY2024 measures list 146 average vacancies, with a goal to lower that figure. The total agency budget administered was about $83.60 million for the FY2026 estimate, and court facilities saw 601,866 visitors in FY2024.
Juvenile Detention Population
Juveniles are held separately from the adult jail. The Juvenile Detention Center is a secure 121-bed facility, currently staffed at 55 beds including the BETA program. It houses youth ordered into the facility by the JDR Court, whether pre-adjudication, post-disposition, or while serving a sentence.
The center provides medical, counseling, mental-health, education, recreation, and case-management services. Its population is governed by JDR confidentiality, so individual data is not public.
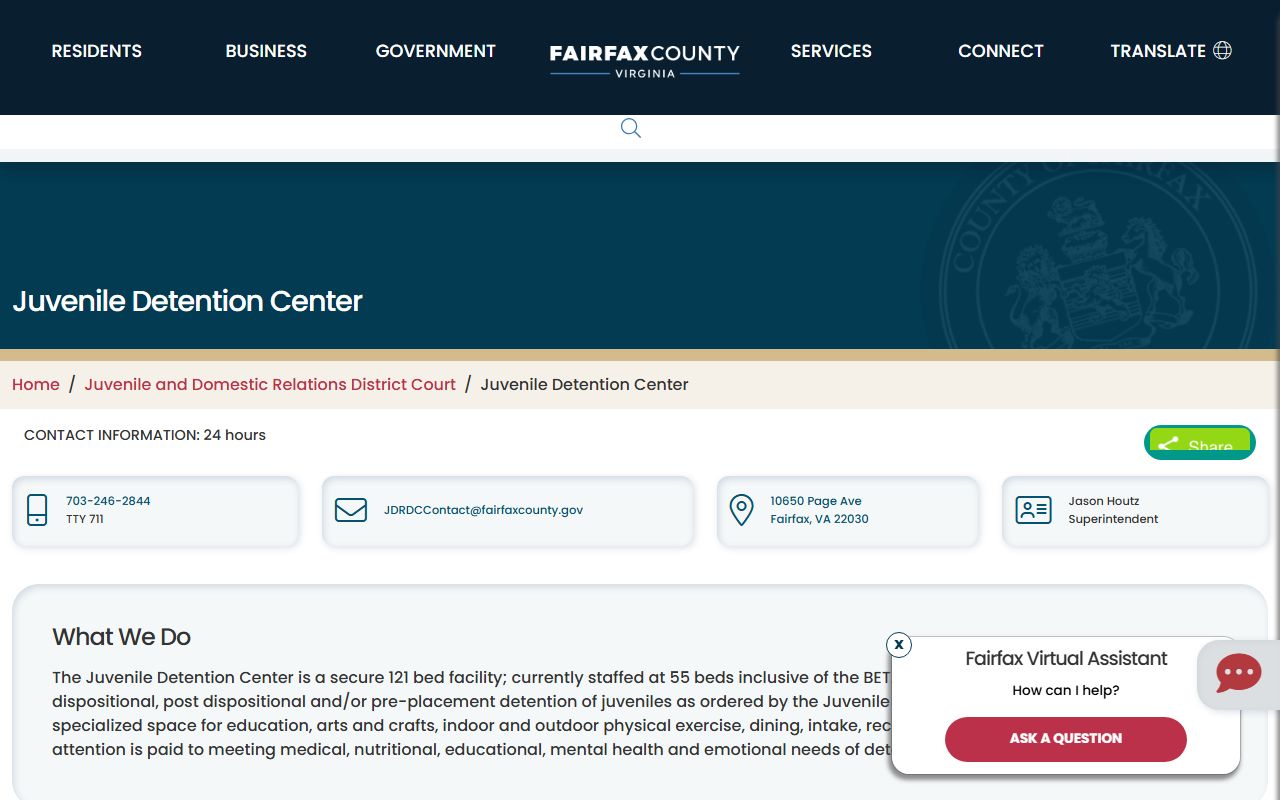
The official Juvenile Detention Center page lists the facility's capacity and services.
National and State Context
National jail population data is compiled by federal sources such as the Bureau of Justice Statistics, which tracks counts and rates across the country. Fairfax does not publish a single county rate per 100,000 in the official source set reviewed, so the figures here are the county's own ADP and capacity numbers rather than a direct national comparison. Reading them as local measures avoids a false rate comparison.
Federal custody is separate from the county jail. A person facing federal charges from Fairfax runs through the Eastern District of Virginia, and sentenced federal prisoners are not tracked by the Sheriff.
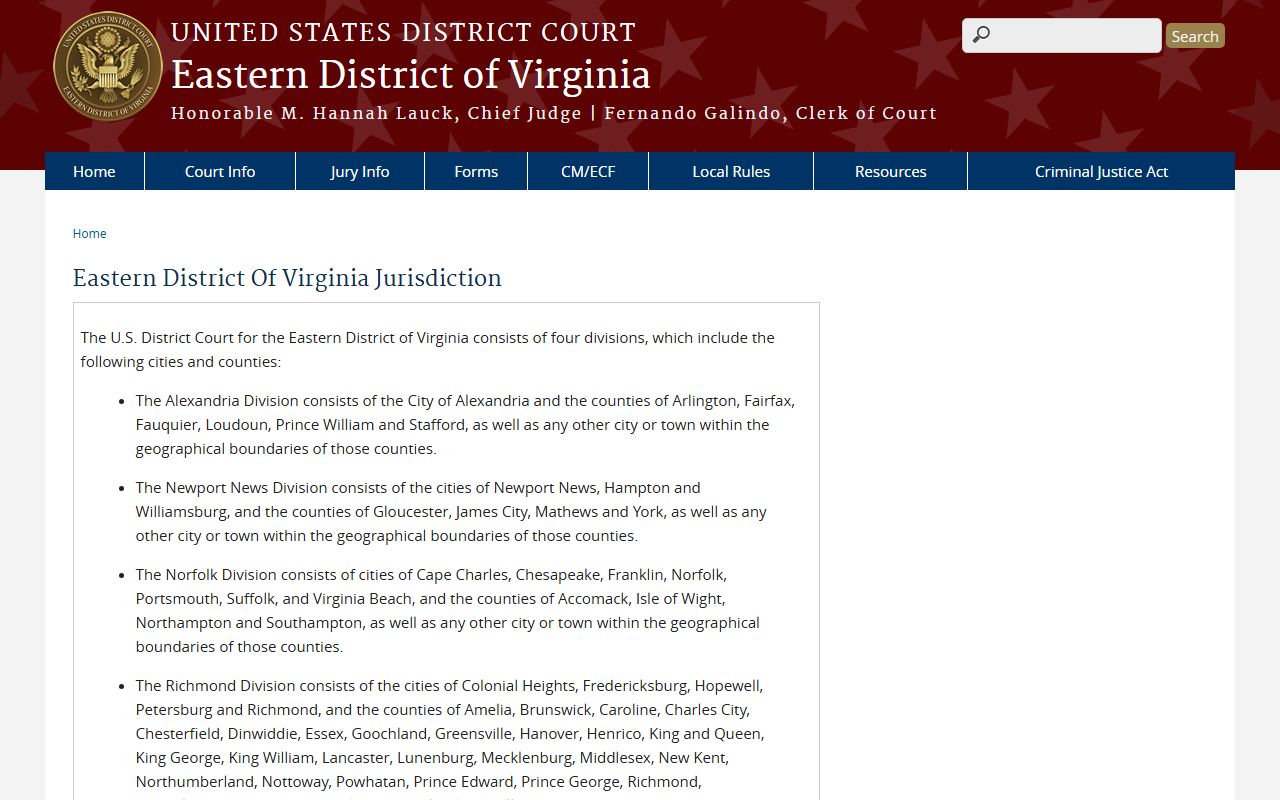
The federal Eastern District of Virginia jurisdiction page lists Fairfax County in the Alexandria Division.
The Inmate Keep Fee
Fairfax charges inmates a daily keep fee to offset housing cost. The amount is $2 per day, deducted from the inmate account. Virginia law sets a ceiling for this charge that is higher than what Fairfax actually charges.
The state authority for the fee is shown in the code.
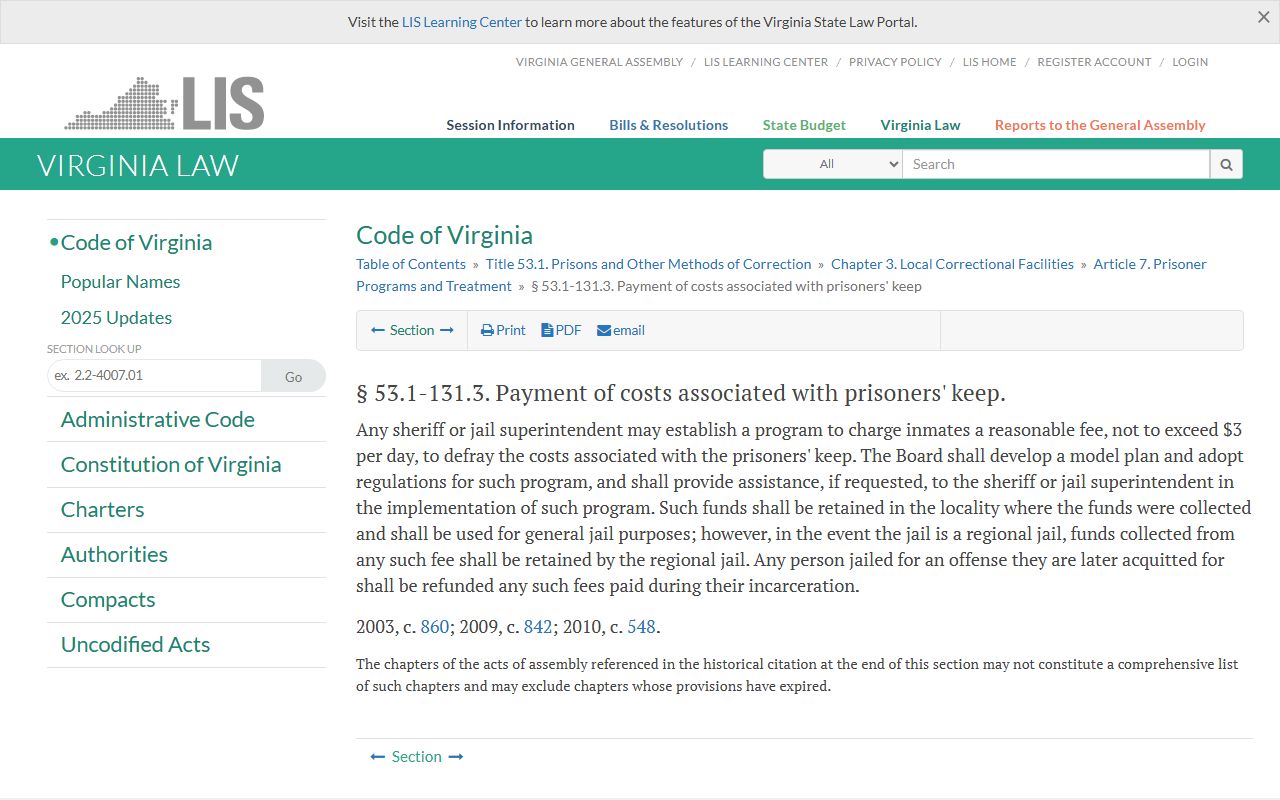
The keep-fee authority is set in Virginia Code § 53.1-131.3, which allows local correctional facilities up to $3 per day.
Searching for Fairfax County Inmate Records by Name
This page covers population data, not individual lookups. To find a specific person, the name search runs through the Adult Detention Center inmate phone line and Virginia VINE, since there is no public online roster. State and federal custody use their own locators.
The full set of name-search steps and tools is on the Fairfax County inmate records page, and release verification is on the released inmates page.
Where the Data Comes From
Every figure on this page traces to an official county source. The demographic and ADP numbers come from the FY2024 Sheriff annual report. The prisoner-day, healthcare, program, and staffing measures come from the FY2026 adopted budget for the Office of Sheriff. Capacity figures follow Virginia Department of Corrections standards.
Note: Fairfax County publishes population figures as annual averages and budget measures, so the most current numbers appear in each new Sheriff annual report and adopted budget.